What this is: 3 of 8 reports from a real garden, made from phone photos.
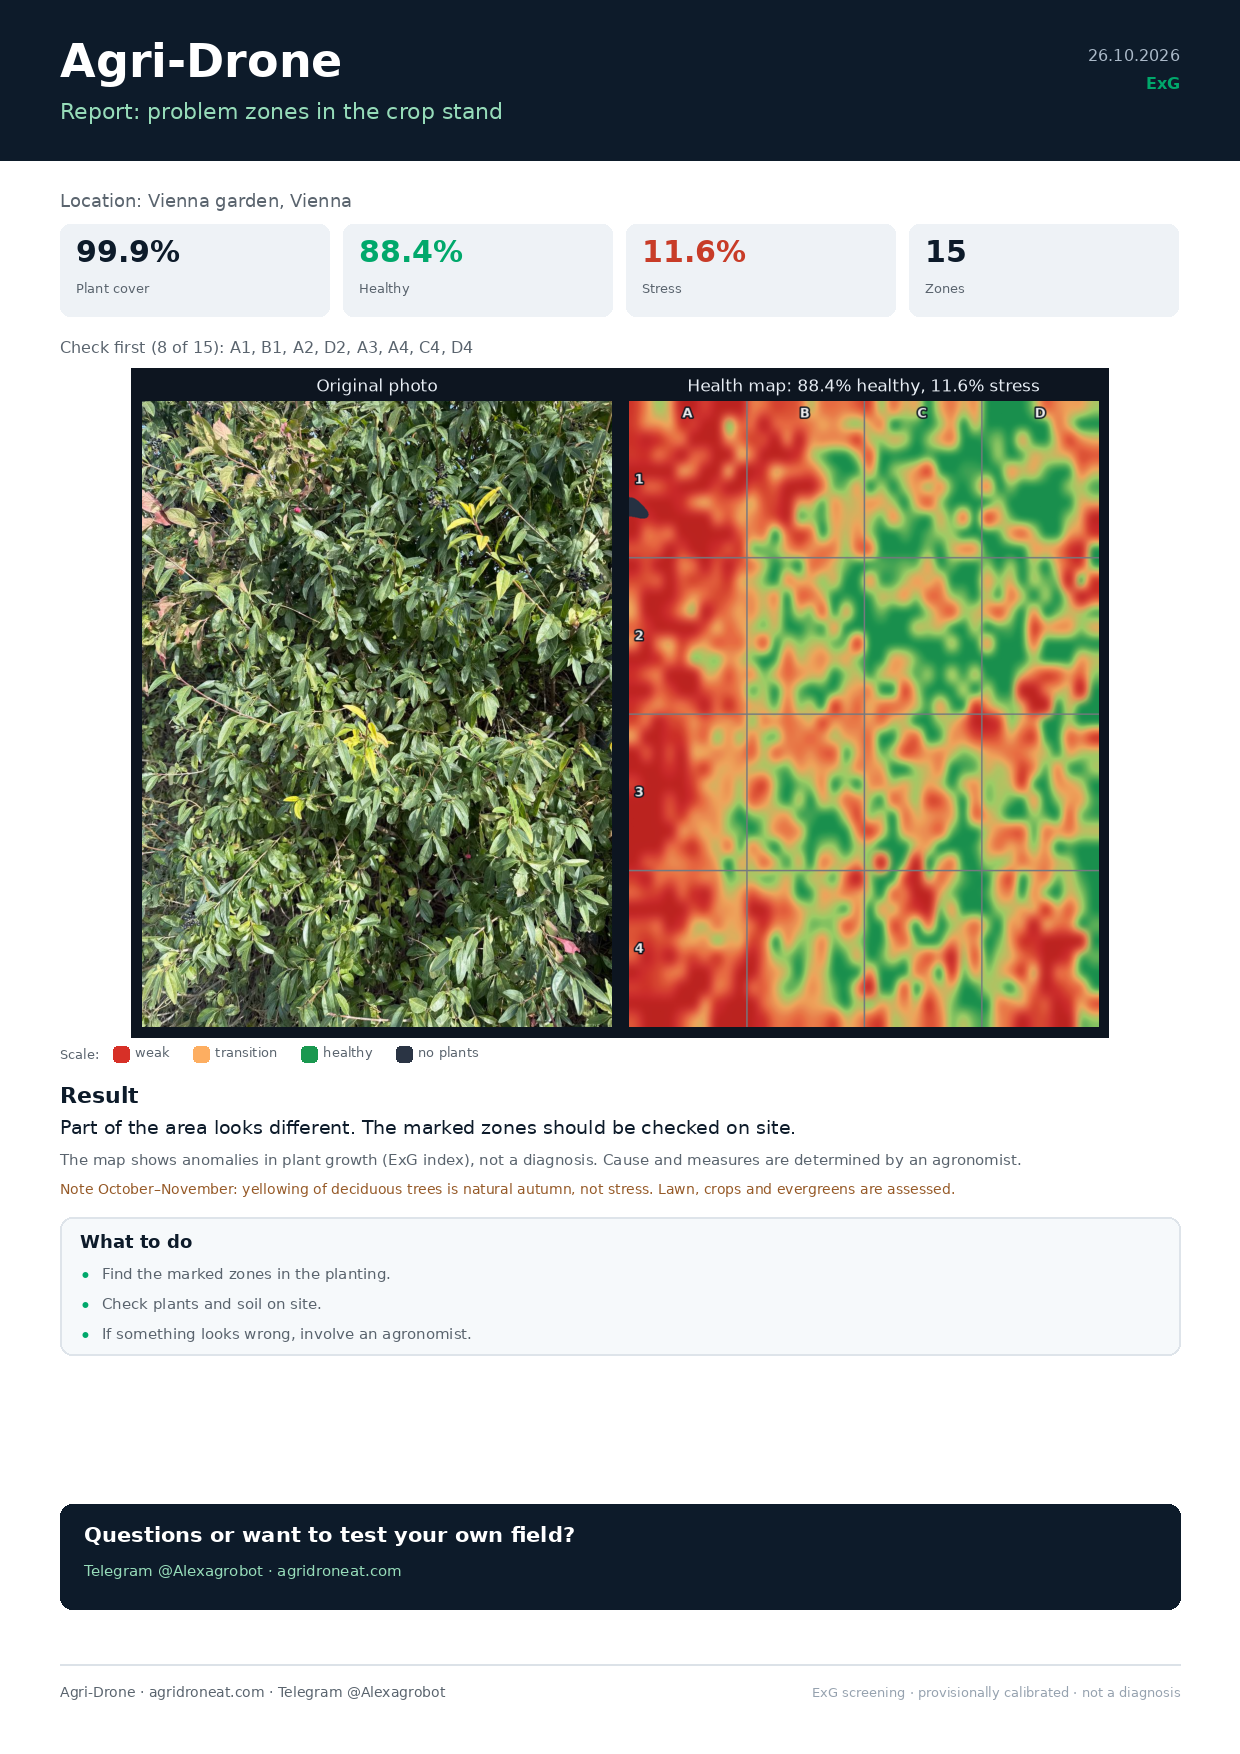
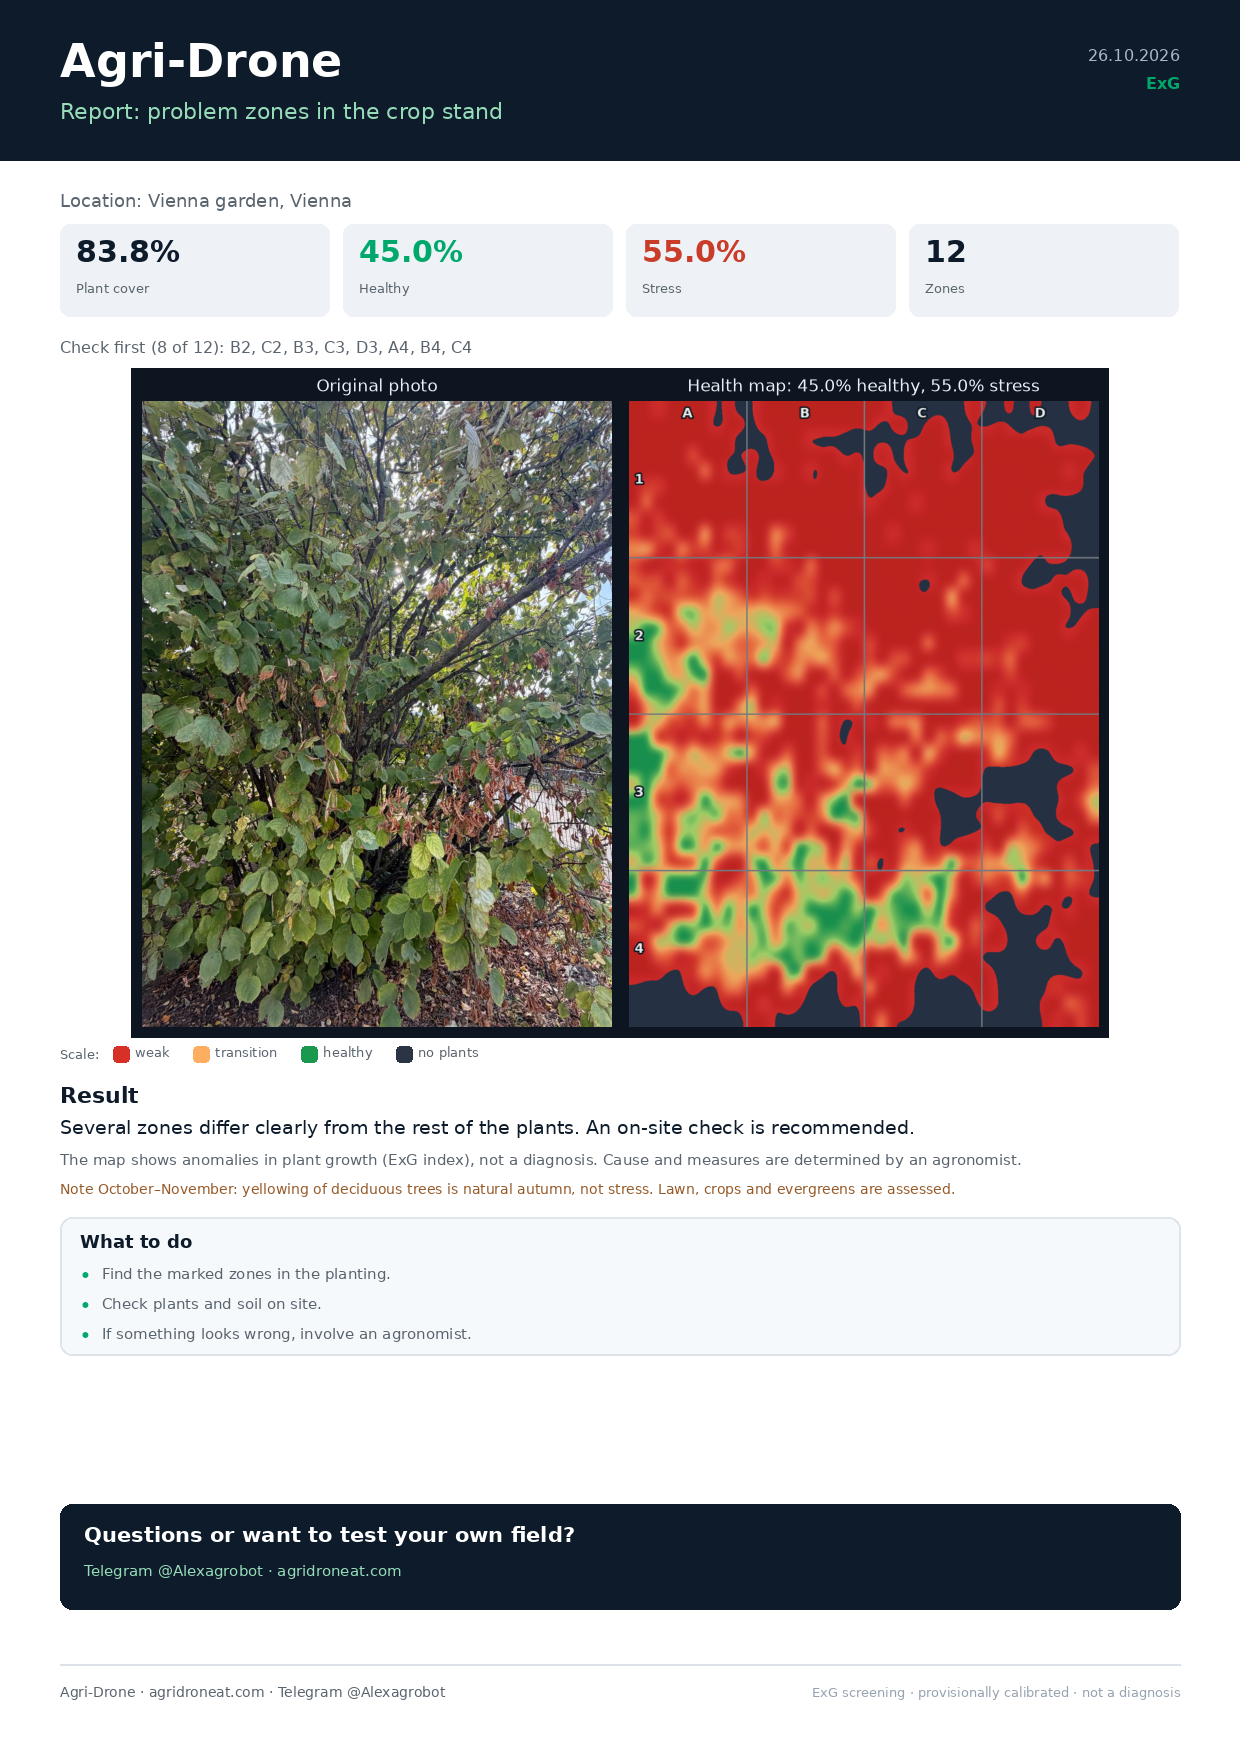
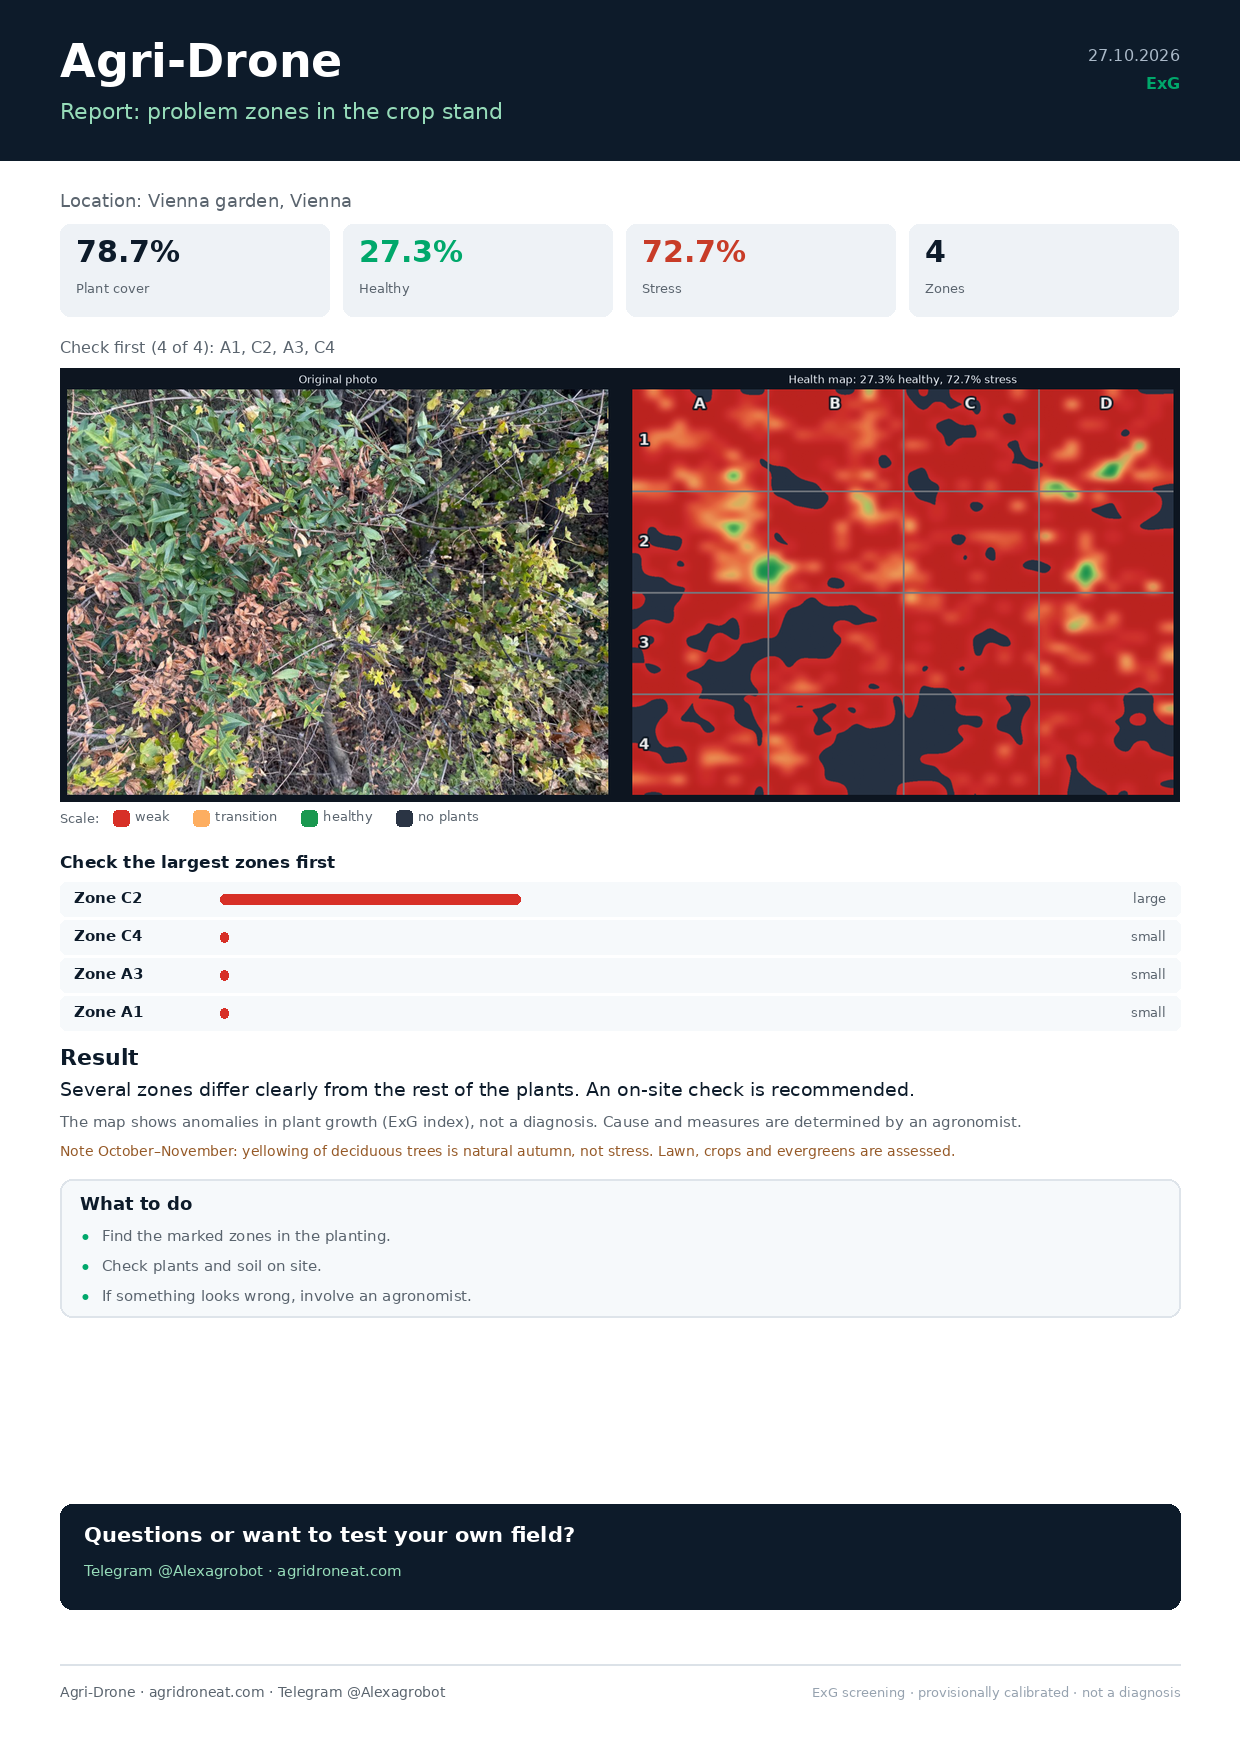
The map shows anomalies in plant growth (ExG index) under an absolute threshold.
It shows no disease, pest or treatment — the agronomist decides.
The threshold is provisionally calibrated and not yet agronomically validated.
Table
| # | Report | Plant cover | Healthy | Stress | Zones | Check first |
|---|---|---|---|---|---|---|
| 1 | garten_18 | 99.9 % | 88.4 % | 11.6 % | 15 | A1, B1, A2, D2, A3, A4, C4, D4 |
| 2 | garten_01 | 83.8 % | 45.0 % | 55.0 % | 12 | B2, C2, B3, C3, D3, A4, B4, C4 |
| 3 | garten_06 | 78.7 % | 27.3 % | 72.7 % | 4 | A1, C2, A3, C4 |
Reports (A4)
What the report does not do
- no disease, no pest, no treatment;
- does not detect holes in leaves — only colour and vegetation differences;
- autumn yellowing of deciduous trees is not stress (note in the report);
- the absolute threshold is provisional, not agronomically validated.
Download
All 3 reports (ZIP) PDF garten_18 PDF garten_01 PDF garten_06